What Are Furniture Buying Tools in Merchandising Software?
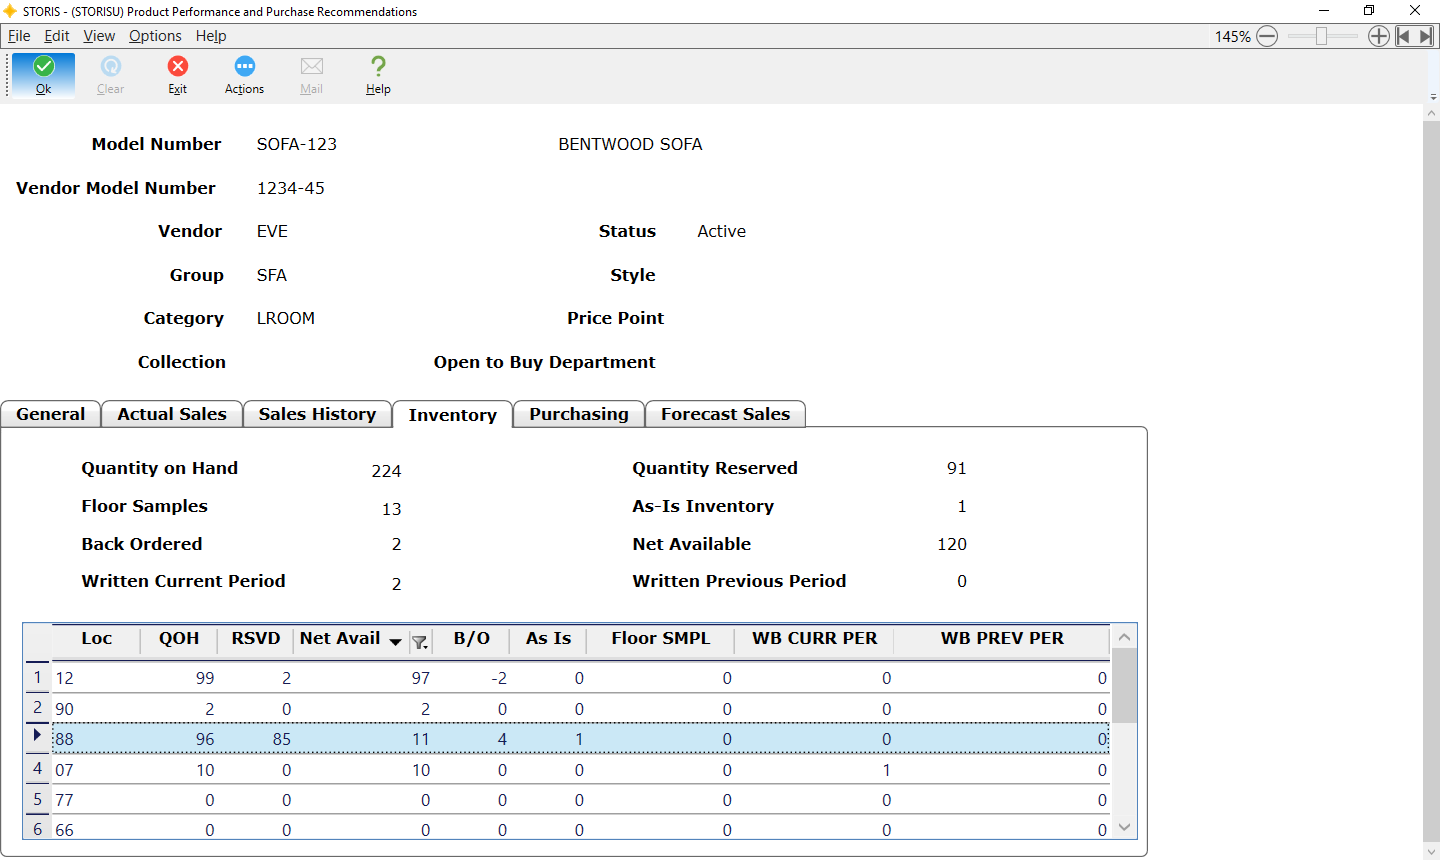
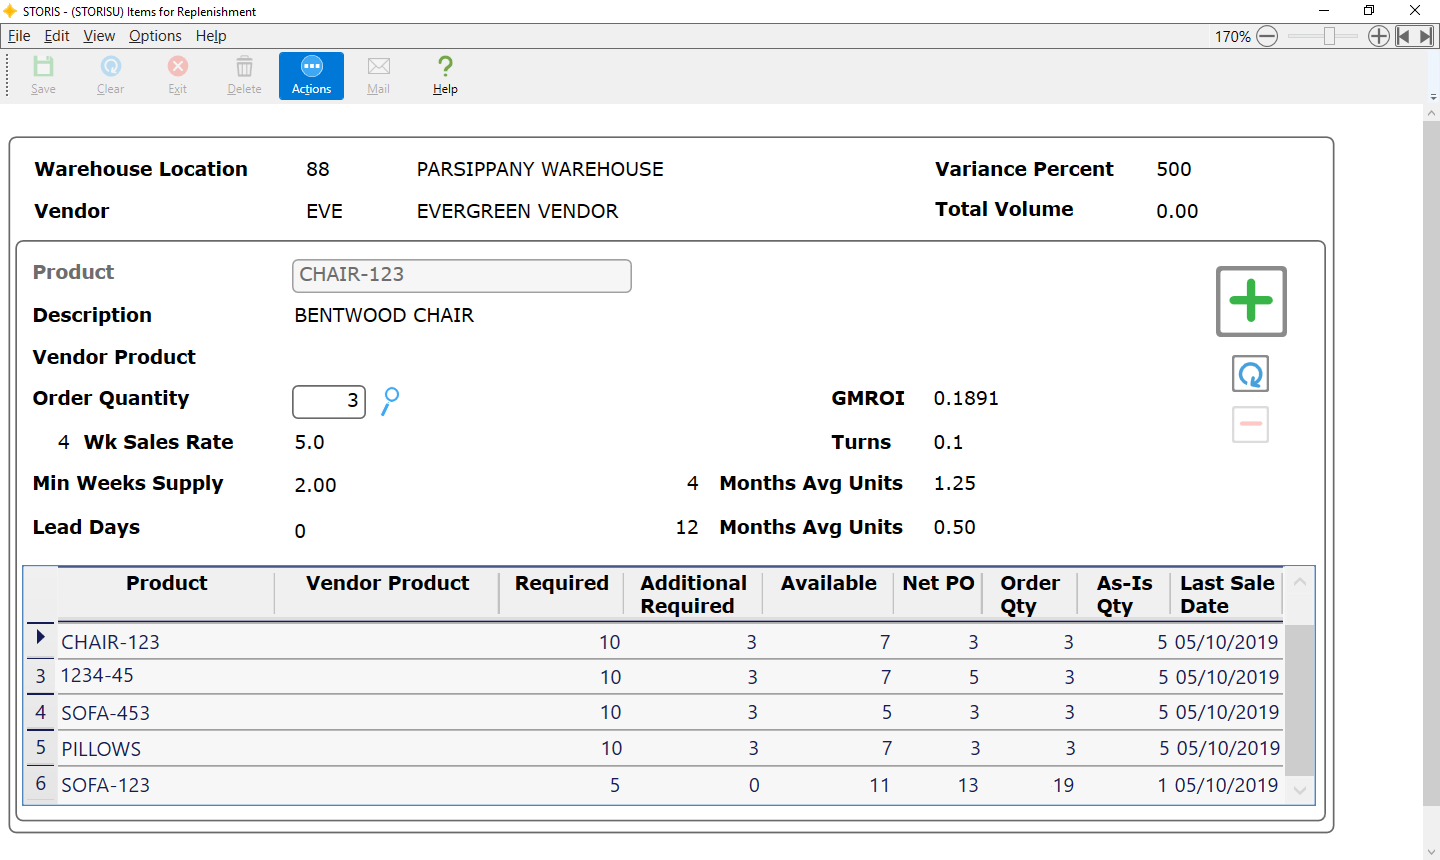
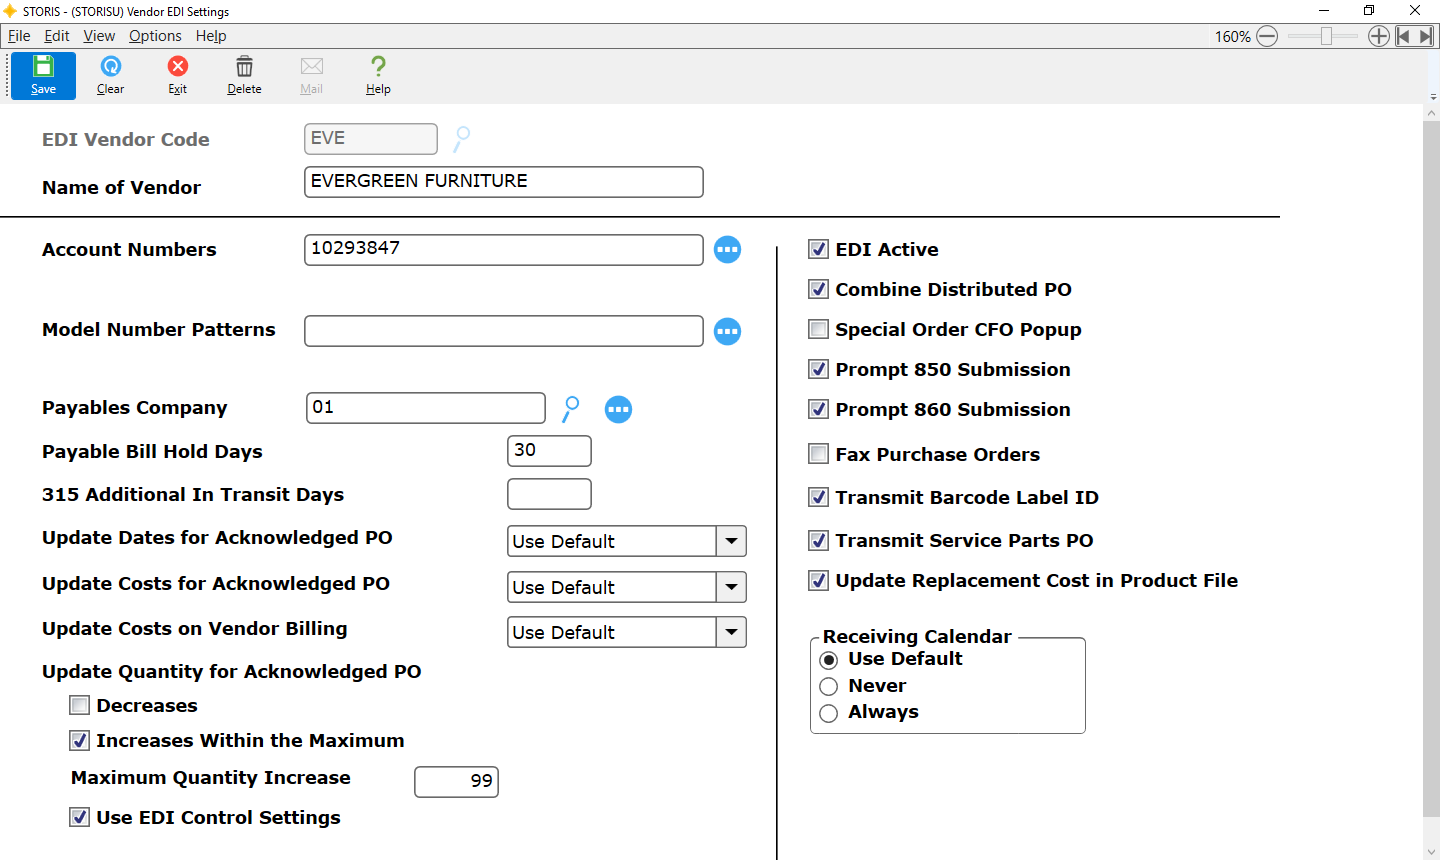
Furniture Buying Tools are excellent resources for the buyers, planners, and merchandisers of your home furnishings retail operation. A Furniture Merchandising Management system enables your team to classify your merchandise, generate Purchase Orders with your vendors, and use a variety of analytical tools to track merchandise performance such as sales, margin, age, and turns.


 When you choose , you get more than an industry-trusted retail software solution. You get the know-how of our team of experts, superior service, and opportunities for growth. Use the form below to learn what can do for you.