Explore New Insights with STORIS’ Business Intelligence Infographic
Click here to access a PDF of our new BI Infographic.
View our Business Intelligence product page here.
What is Business Intelligence?
Business Intelligence is a technology-driven process that transforms data into actionable insights to help executives, managers, and other company end users make strategic business decisions. Each customer interaction is a specific data point that, once processed through a BI solution, delivers valuable insight to drive business forward.
Analyze Your Approach to Business Intelligence
Request a DemoFill out the form to discover STORIS' Business Intelligence technology, designed specifically for the home furnishings industry.
Fill Out the Form to Learn More

Characteristics of BI
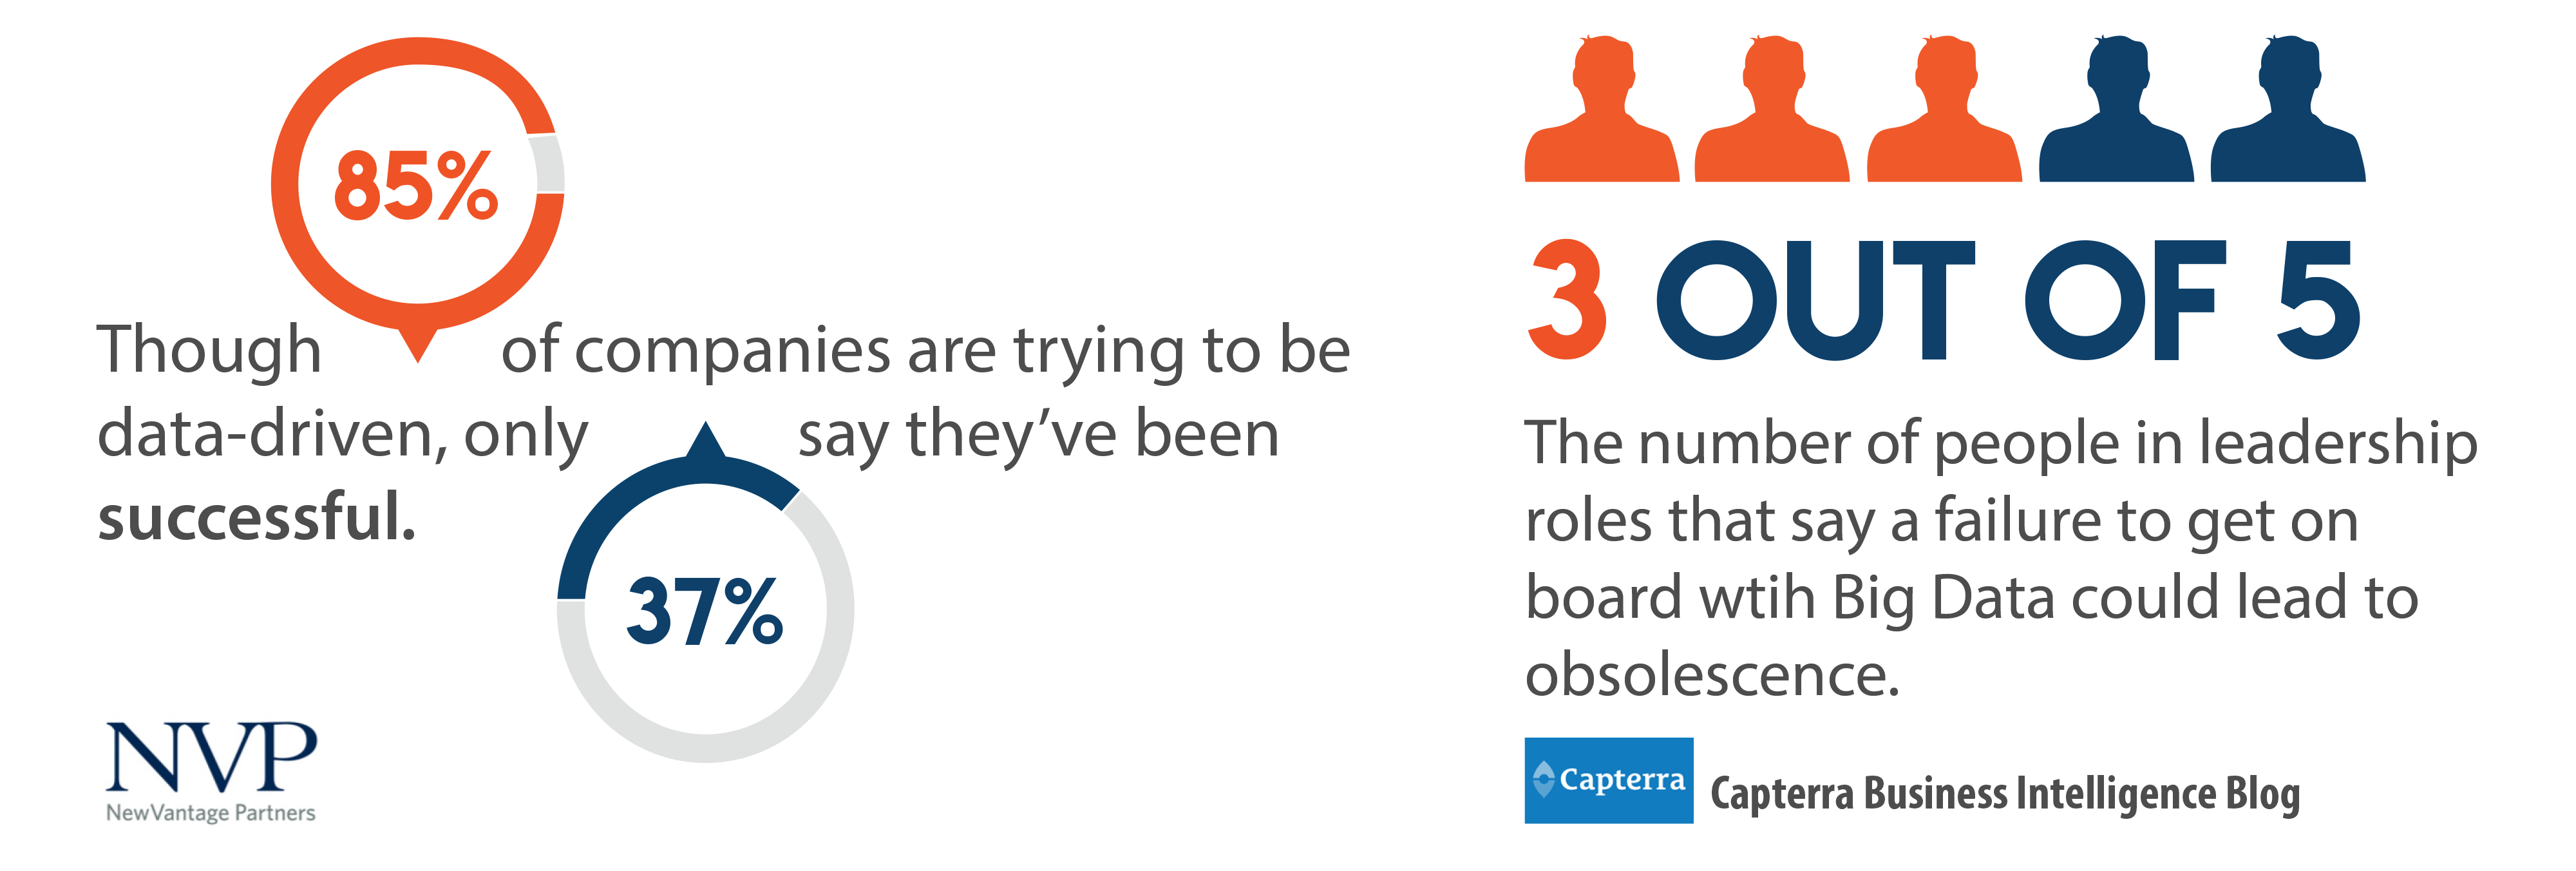
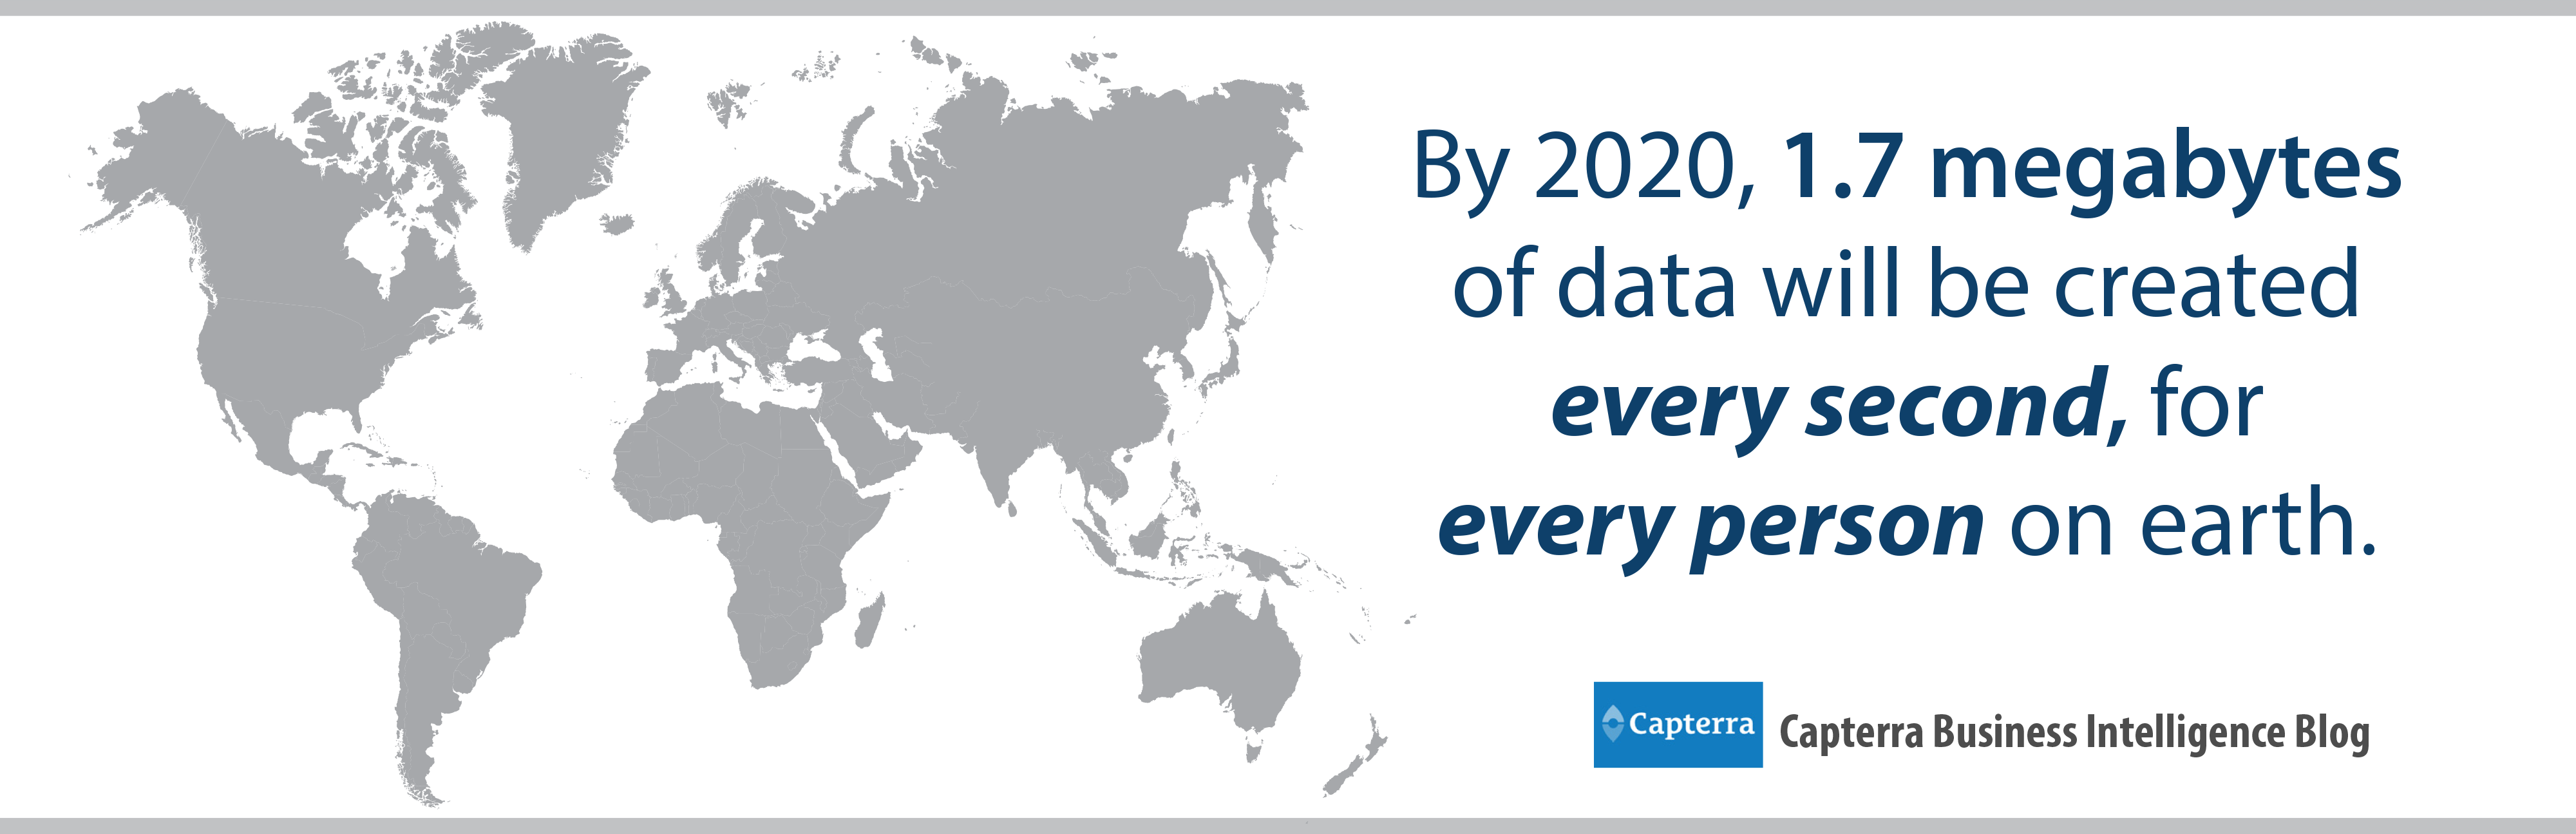
Companies excelling in retail today fuel their businesses with the power of data. BI provides real-time and historical data to help businesses improve decision-making, optimize business processes, increase operational efficiency, and gain a competitive advantage.
Unified
Home furnishings customers interact with retailers in-store and online. Unified BI solutions enable retailers to analyze data from multiple sources to fully understand what is driving performance and learn more about their customers.
Accessible
Today, synthesized data collection occurs on the back-end of a system, instead of through complex queries. This makes data widely accessible through intuitive front-end design, empowering more individuals to start uncovering key findings.
Actionable
With the vast amounts of data collected today, visual interfaces such as dashboards, charts, and tables make it easy to isolate trends. Drill-down, real-time tools allow the user to dive further into actionable results.
Collaborative
Strong Business Intelligence solutions help their users share results and communicate strategy across an organization. Sharing reports, scheduling updates, and enabling visibility on all devices foster business growth.
Mobile Dashboards
Today, BI must be accessible on mobile devices. Mobile BI provides data-driven, analytical insights to both smartphones and tablets. This allows retailers to instantly view and analyze existing analytical content from wherever they are.
Mobile BI puts important information right in front of executives, managers, team leaders, and IT technicians to evaluate and facilitate operational performance.
Sales personnel working on the showroom floor can pull up any information they need, such as product knowledge and trends, directly from their smartphones. This improves efficiency and customer service while allowing them to make well-informed decisions.
BI Security
BI must also have securities and distribution controls built into it. This allows users to share analyses across an organization, while still maintaining the security of sensitive business information.
Admin Users– manage user groups and permissions to sensitive and secure information.
Editor Users – can build and edit company reports, manage fields, and create KPI calculations.
Viewer User– can interact with reports assigned to their workspace and analyze results.
Types of BI Tools
Front-end graphical dashboards and visualizations help make data consumable for the end user. Ideally, BI users have different types of tools available to build personalized reports and dashboards in a drag and drop interface. This allows users to dive deeper into their findings to the benefit of their own business sectors and drive overall performance.
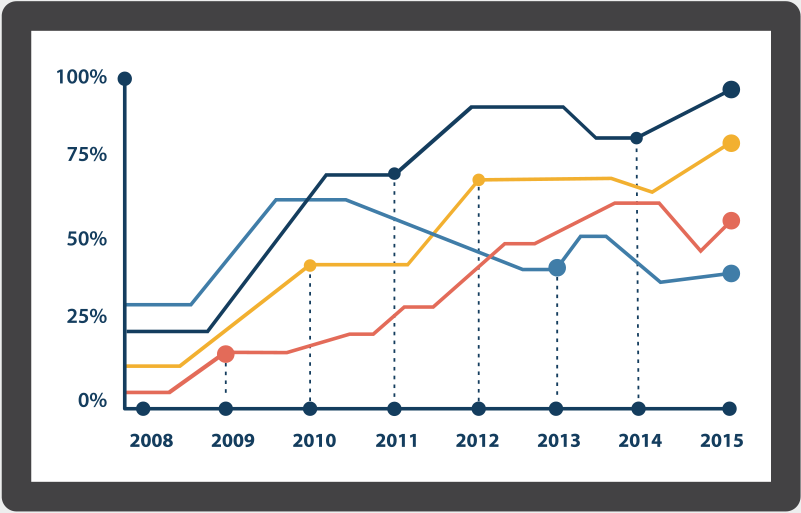
Line Graph
Line graphs
compare data over an amount of time to illustrate trends among a specific data series.
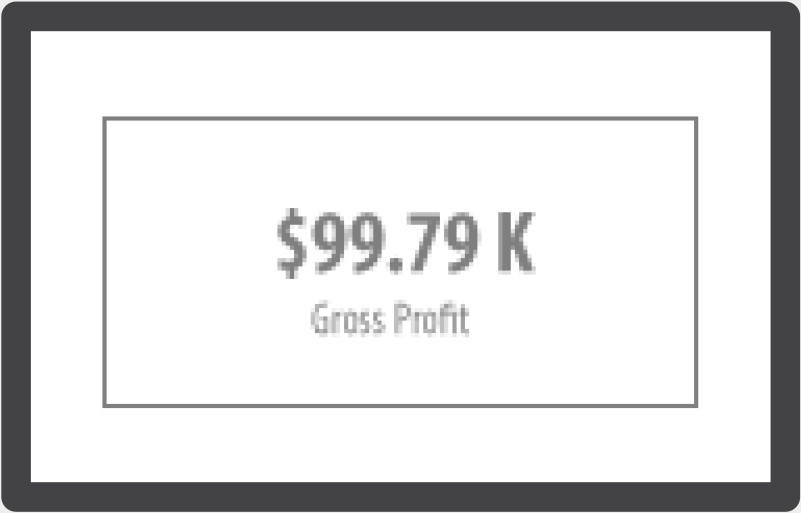
Card
Cards are useful for showing the immediate value of a KPI, such as a total or percentage
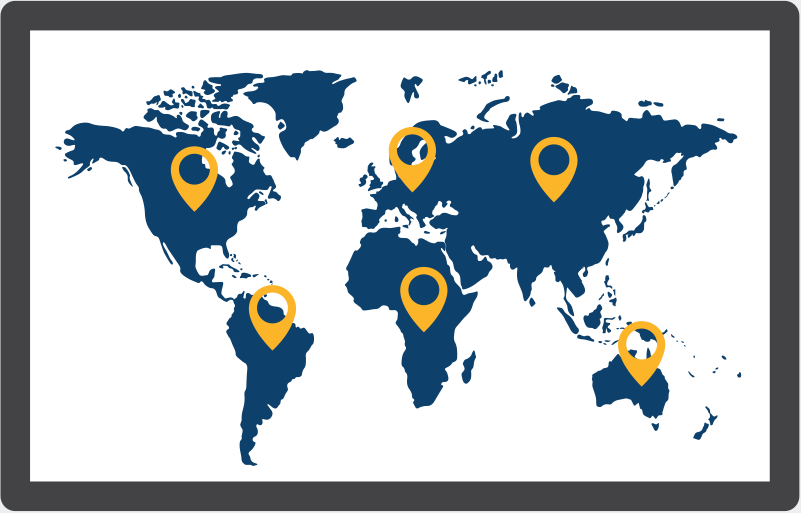
Map
Maps extend your data to demonstrate trends and patterns on a global scale.
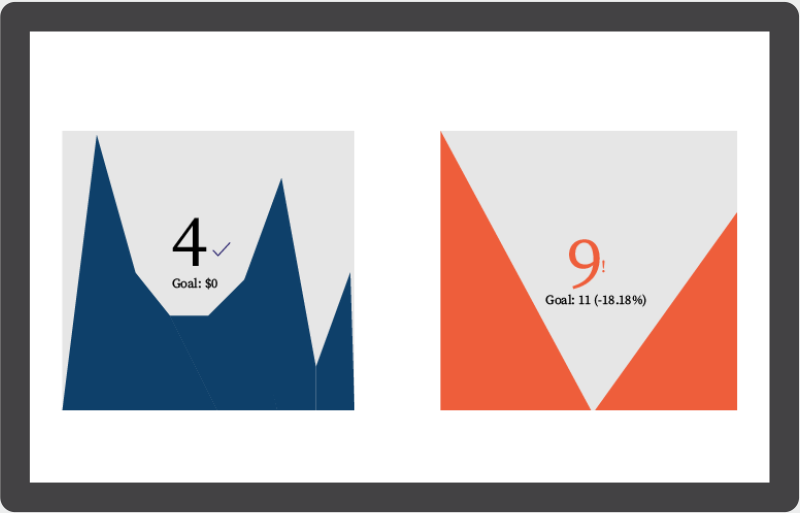
KPI
KPI’s show real-time values along with a performance indicator or goal value.
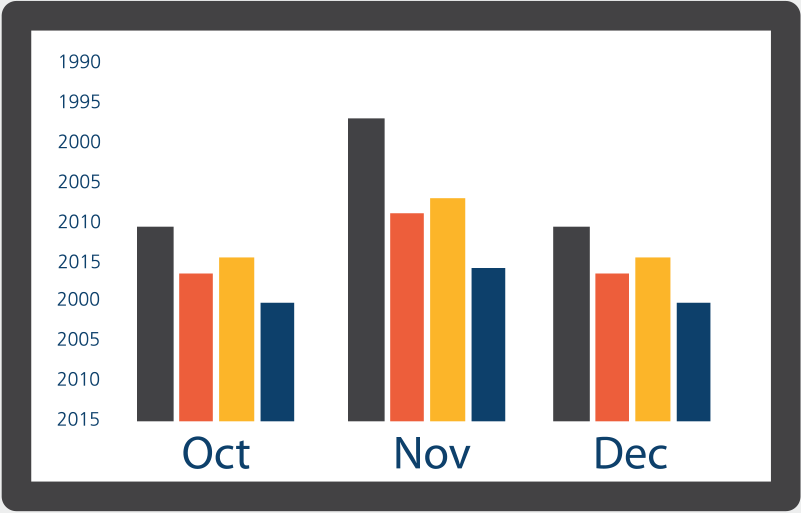
Column Graph
Column graphs display a comparative ranking of categories grouped within a series.
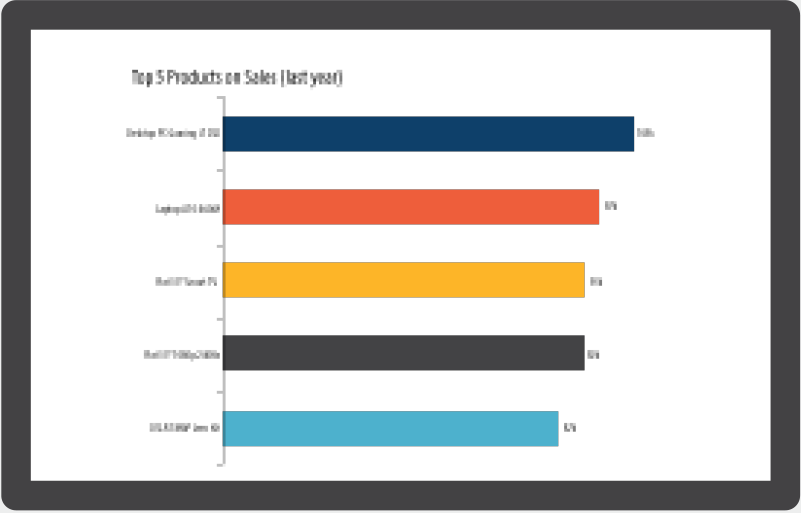
Bar Graph
Bar graphs can be used to display comparisons between values with a bar representing each value.
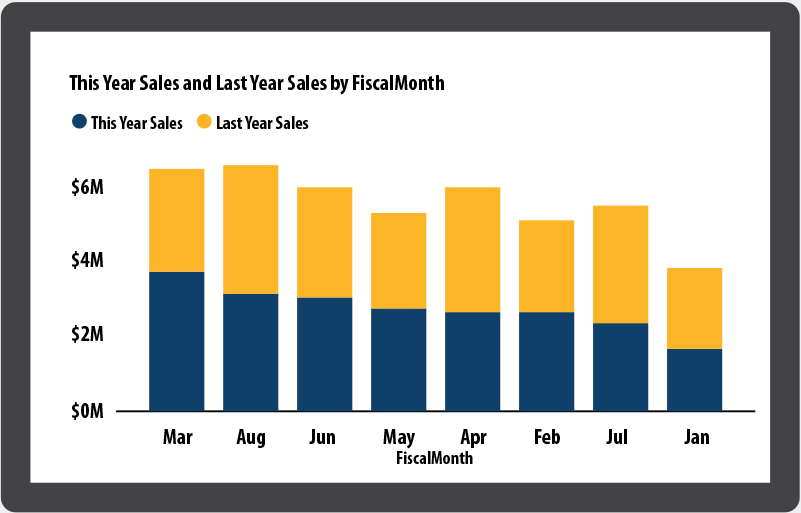
Stacked Chart
Stacked charts display comparisons that have a part to whole relationship. Each bar represents a whole and each segment represents a part.
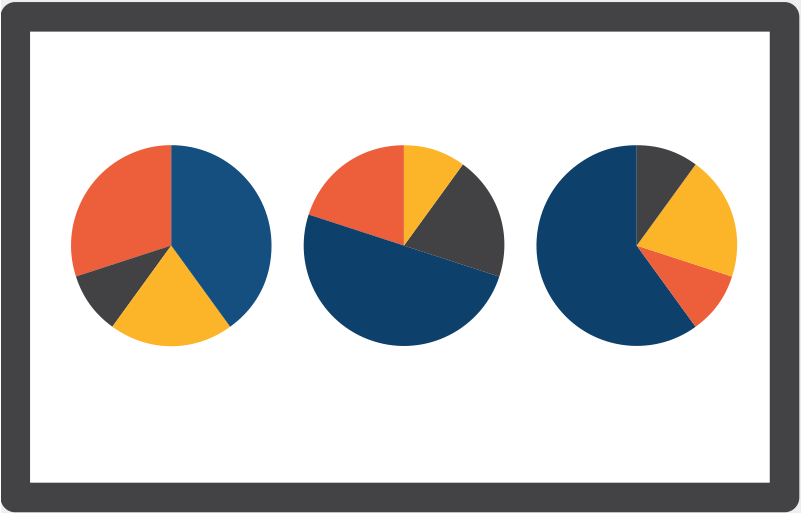
Pie Chart
Pie charts are ONLY used when all categories add up to 100% and there’s a visible difference in measurement between the categories.
STORIS BI Goals
STORIS has launched a new Business Intelligence suite designed for home furnishings retailers. STORIS BI comes with industry-specific, calculated measures designed in conjunction with STORIS’ retail early adopters and data provided through STORIS’ transactional database. These datasets allow new users to dive right into their analyses. This also reduces formerly IT-reliant SQL knowledge needed to construct queries.
- Increase Data Accessibility
- Synthesize Analyses Across Selling Channels
- Enable More Individuals to Drive Findings
- Targets All Roles
- Executives and Administrators Management
- Management
- Company
- Employees
- Sales Personnel
Microsoft Azure and Power BI
Microsoft Azure and Power BI technologies are the foundation of STORIS’ BI solution. Microsoft Azure is a flexible, fully managed relational cloud computing platform build for developers. Power BI is Microsoft’s cloud-based BI platform. Microsoft has been positioned as a Leader in Gartner’s 2018 Magic Quadrant for Analytics and Business Intelligence Platform.
Analyze Your Approach to Business Intelligence
Business Intelligence is a key component of a company’s success. STORIS’ BI is designed specifically for the home furnishings industry and promotes a data-driven culture with strategic and visually engaging analytics. BI capabilities provide retailers with enhanced data quality and improved employee satisfaction while helping to identify trends and make better strategic business decisions.
STORIS is committed to the technological advancement of the home furnishings industry. Our proven Unified Commerce Solution is the foundation of our offering.
 When you choose , you get more than an industry-trusted retail software solution. You get the know-how of our team of experts, superior service, and opportunities for growth. Use the form below to learn what can do for you.